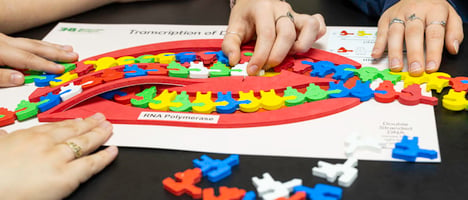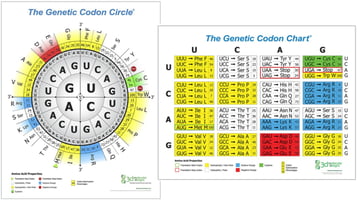




You already ask students to “follow the flow” of information from DNA to RNA to protein. But if you teach intro college biology or advanced high school, you’ve probably watched students rush through translation, treating the ribosome like a black box that magically spits out amino acids. A simple pause point with a codon chart can slow that process down just enough for them to see what translation really is: a series of codon-by-codon decisions with chemical consequences.
In this post, you’ll add a short “Stop, Decode, Discuss” moment to your Flow of Genetic Information Kit© (FGIK) lab and use the Genetic Codon Chart’s color scheme to slow translation just enough for students to notice side‑chain properties. The focus stays on one short mRNA, a 10‑minute pause at the start of translation, and a first connection between codons, color, and folding—not yet on full disease case studies or codon‑bias deep dives.
A 75-minute vignette: when the yellow amino acids click
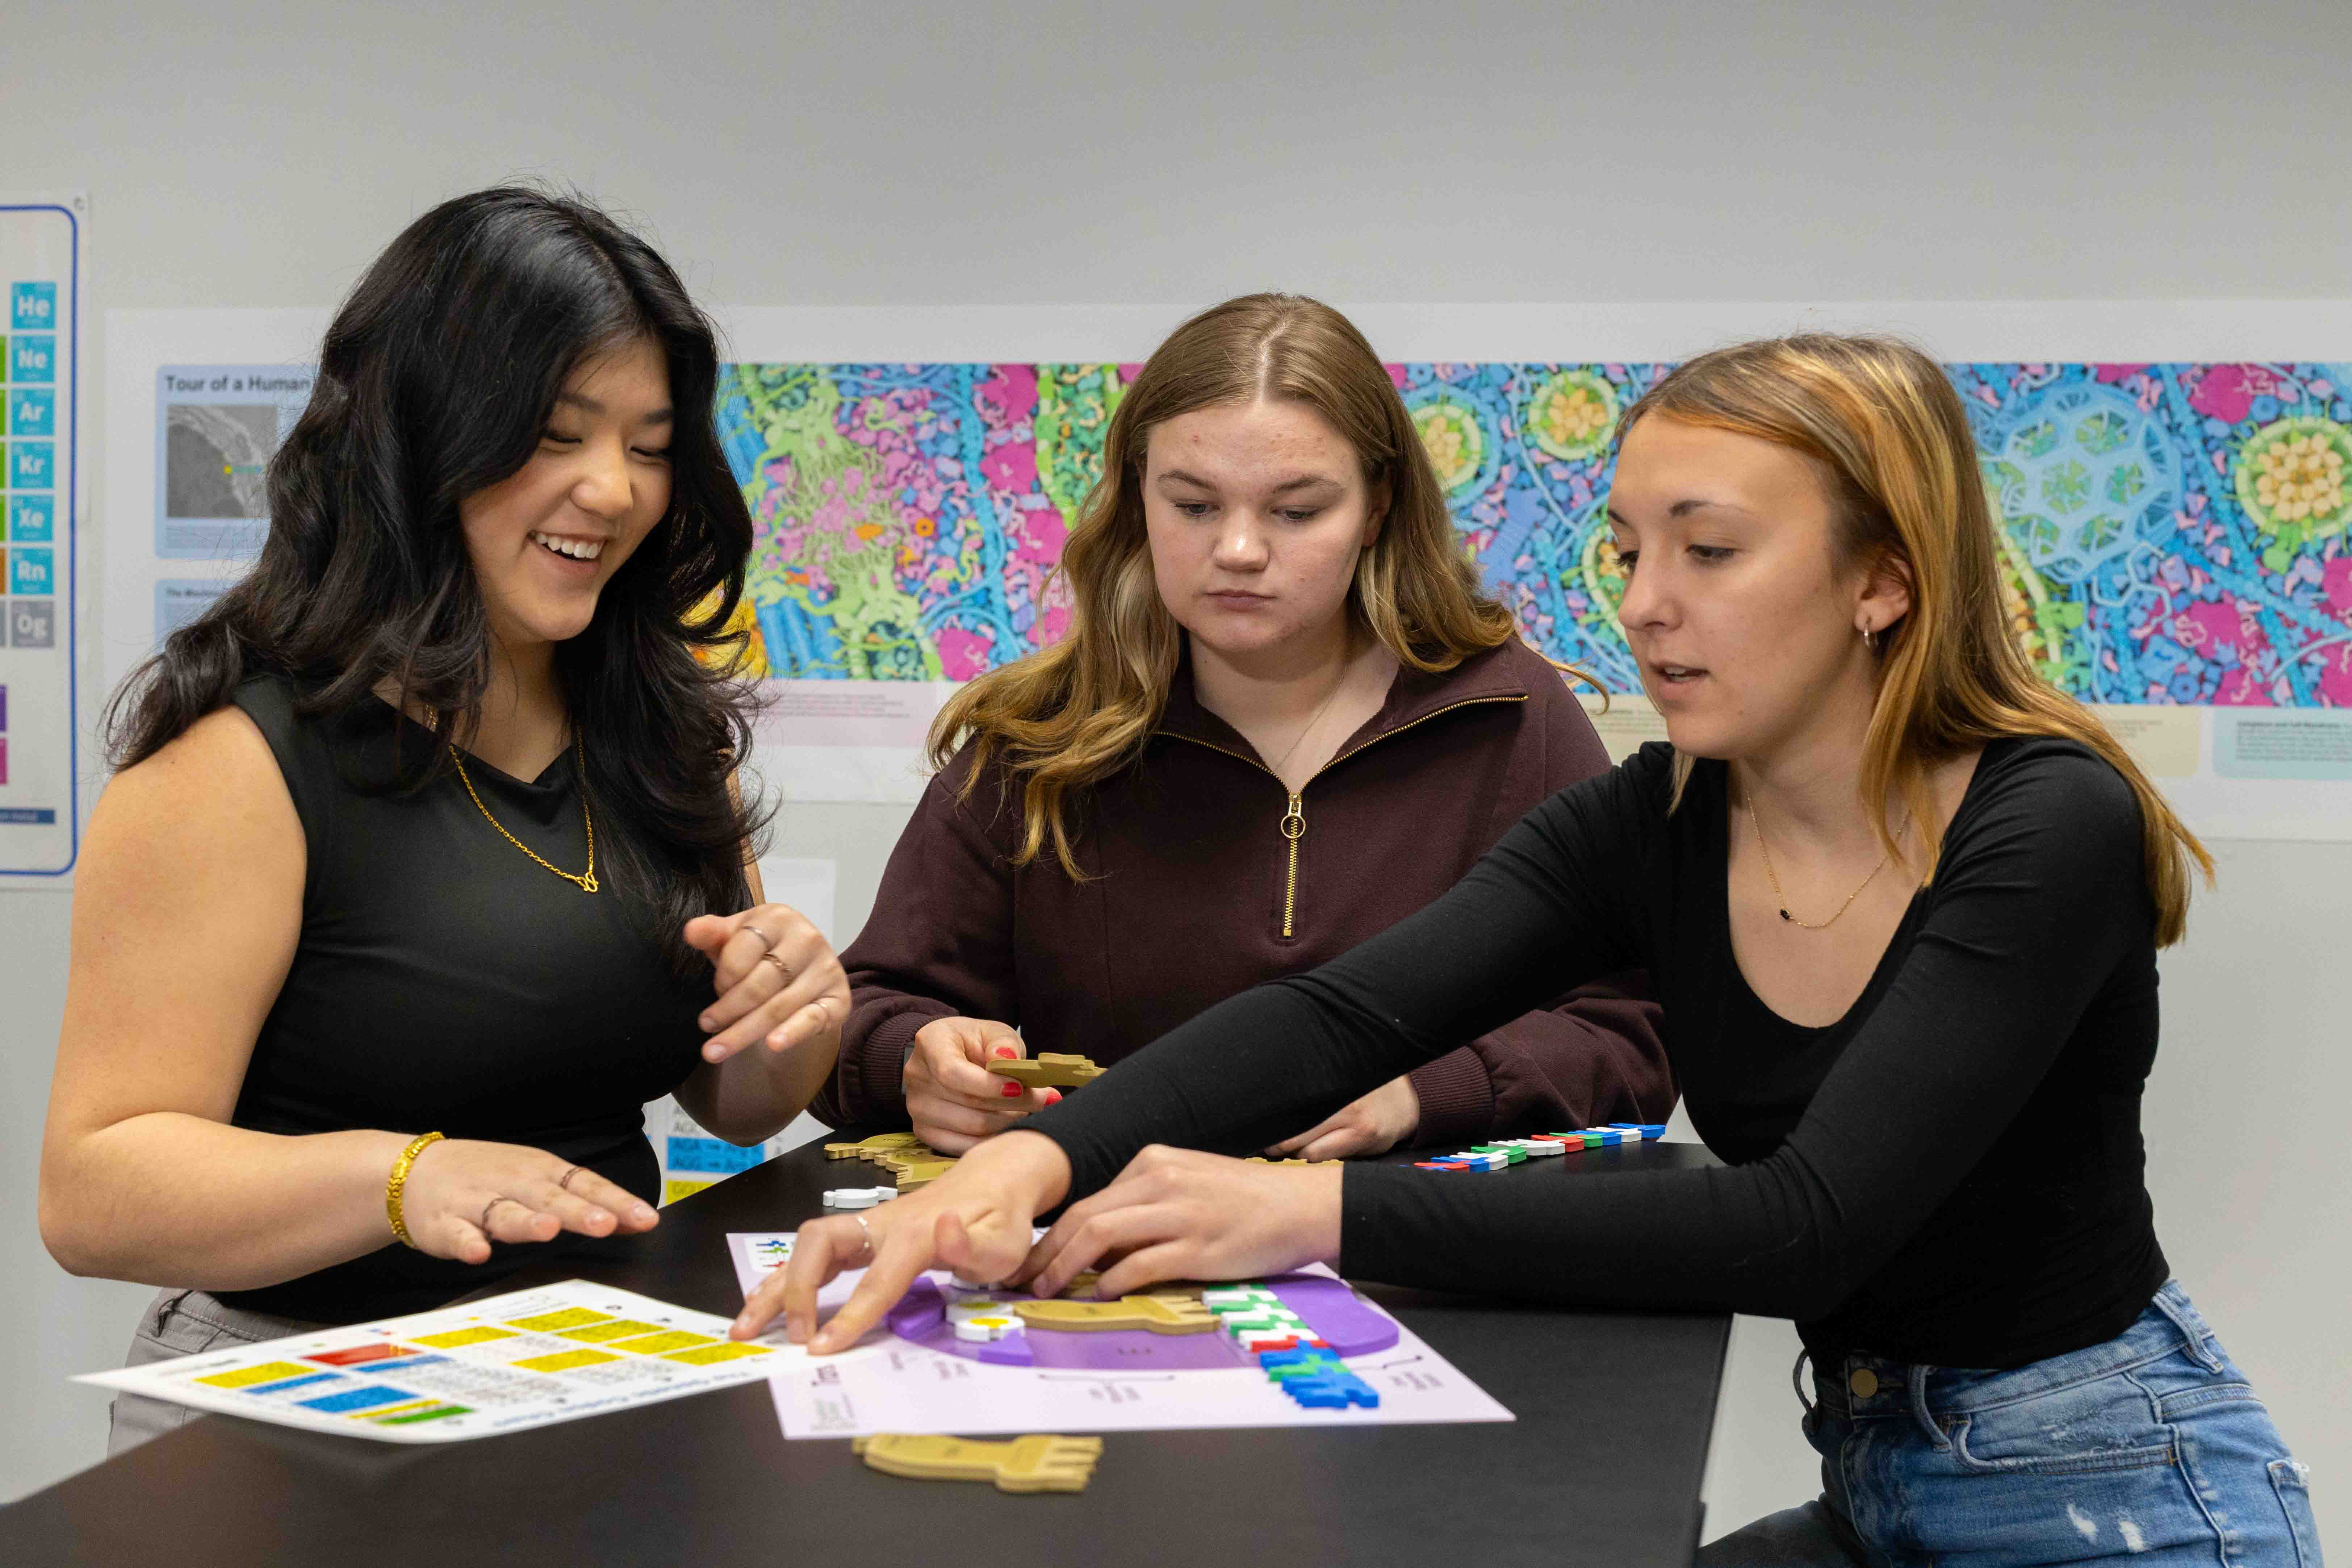
Picture your intro biology for non-majors class on a Tuesday afternoon. Students have just modeled transcription with the Flow of Genetic Information Kit© and lined up their mRNA on the ribosome placemat, ready to start building a protein. Before they reach for the foam amino acids, you ask them to stop and pick up the Circle or Table Genetic Codon Chart.
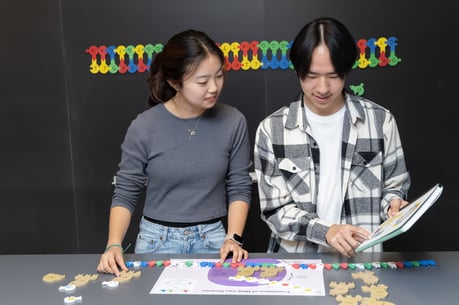 You hand out a short mRNA sequence (from the Codon Chart activity sheets) and give them three quick steps: mark the start codon, underline each codon, and decode codon-by-codon using the chart—saying aloud “codon, amino acid, next codon” as they go. After a few codons, you add: “Now, when you find each amino acid, call out its color from the chart as well.”
Within a minute, some groups notice a stretch of yellow amino acids in a row. You pause the room and ask, “If this yellow run belonged to a real protein, where would you predict it ends up in the folded structure—buried or exposed?” Students now have to connect the sequence they just decoded with hydrophobic cores and hydrophilic surfaces, instead of memorizing “proteins fold.”
Why pause at translation?
The Flow of Genetic Information Kit© already helps students see replication, transcription, and translation as tangible processes instead of abstract diagrams. Adding a codon chart pause point at translation turns that physical modeling into a decoding exercise, where each step depends on reading sequence information correctly.
When you insert the chart right as they begin translation, you ask students to do more than follow directions on the placemat. They must identify the correct reading frame, start at the first AUG, and match each triplet codon to a specific amino acid rather than relying on foam pieces or memory alone. In the process, they see that a one-nucleotide change can shift codons, alter amino acids, or even introduce a stop signal. At this stage, it is enough for students to recognize that translation is rule‑based and fragile in specific ways; you can save richer mutation and disease examples for a later lesson when they are ready.
The codon chart as a chemical map
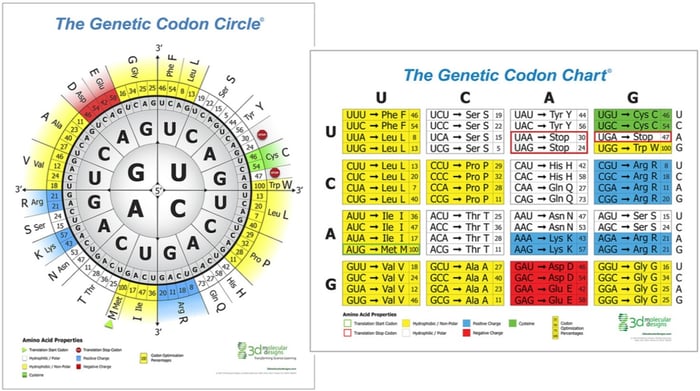
The Genetic Codon Chart is more than a reference table. It encodes amino acid side-chain properties by color: yellow for hydrophobic, white for polar, blue for basic (positively charged), red for acidic (negatively charged), and green for cysteine. When students call out both the amino acid and its color, they suddenly see that they are building a chain with a distinct chemical personality, not just a string of letters.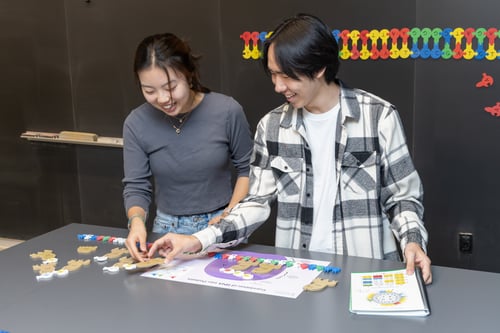
That color coding invites simple structure‑function predictions that students can make on day one. A stretch of yellow hydrophobic residues becomes a likely candidate for the protein’s interior, while scattered red and blue residues suggest charged segments that could face the solvent or form salt bridges. In a 60‑second pause, students move from “I translated the sequence” to “I can start to guess which segments might pack into a hydrophobic core and which might stay on the surface."
Classroom move: stop, decode, color, predict
Here’s a compact way to run this pause point with intro college or advanced HS students.
- Flag the start codon
Ask students to find and highlight the first AUG in their mRNA before placing it on the ribosome placemat. Have them quickly explain why starting at the wrong AUG would shift every downstream codon and scramble the protein. - Decode out loud, one codon at a time
Have each group translate 3–5 codons using the codon chart, saying aloud “AUG – Met,” “next codon,” and so on. This slows them down just enough to catch skipped bases and mis-readings, turning the chart into a check on both accuracy and reading frame. - Call out color-coded properties
After a few codons, layer in the properties: “Val – yellow,” “Asp – red,” “Lys – blue.” Then ask students to mentally sort their sequence into “hydrophobic core candidates” (mostly yellow) and “likely surface or charged segments” (white, red, blue). - Predict a structural role
Once they’ve decoded a short stretch, prompt them: “Which segment of your peptide is most likely to be buried in the folded protein, and why?” Their answers have to cite both sequence and chemical property, not just patterns on the chart.
This sequence fits comfortably into a 10-minute slice of a 75-minute class and works equally well as a brief intervention in an advanced HS section.
Discussion prompt: hydrophobic vs charged segments
You can turn this moment into a quick, targeted discussion using prompts already built into the guide.
Try asking:
- “If you see a stretch of yellow amino acids in your translated sequence, where might that segment end up in a folded protein, and why?
- “Why might a mutation that changes a blue basic amino acid to a red acidic one have a bigger functional impact than a mutation between two yellow hydrophobic residues?”
The first question pulls students from “I see yellow” toward using words like “buried” and “surface” when they talk about folding. The second pushes them to recognize that charge reversals can be more disruptive than “hydrophobic-to-hydrophobic” swaps, even though both are missense mutations at the sequence level.
Quick mutation extension: silent, missense, nonsense
If you have a few extra minutes, you can repurpose the same mRNA sequence for a focused mutation check-in.
Ask each group to choose one codon, change a single nucleotide, and return to the codon chart to classify the result as silent, missense, or nonsense. Then follow up with: “Did this change also switch the color category of the amino acid?”
Students see that:
- Silent mutations can change codons without changing either the amino acid or its color, giving a concrete example of degeneracy.
- Missense mutations that stay within the same color (yellow to yellow) may be more conservative than those that flip from blue to red or from yellow to white.
- Nonsense mutations terminate translation at a “Stop” codon on the chart, cutting the peptide short.
In one short extension, they connect base-level changes to codons, amino acids, and side-chain chemistry—all within the same activity.
In this activity, the focus stays on classifying mutations and noticing whether amino acid color categories change, not on predicting full protein behavior. You are giving students a concrete way to connect base‑level changes to codons, amino acids, and side‑chain chemistry that you can return to in later units.
Optional Sidebar: a first glimpse at codon preferences
If you want to give students a very quick first look at codon bias in humans, you can use the codon preference values on the Circle Chart as a short optional challenge. Treat this as a teaser rather than a full lesson; the goal is simply to plant the idea that synonymous codons are not used equally.
For students ready for a small challenge, you can use the codon preference values on the Circle Chart to nudge them toward the idea that not all synonymous codons are used equally in humans.
Have them find two different codons for the same amino acid (for example, two leucine codons) and compare the percentages printed on the chart. Then ask, “Why might cells prefer one codon over another if they encode the same amino acid?” You can keep the explanation simple—mentioning tRNA abundance or translation efficiency—while still giving students a taste of codon bias.
This quick sidebar reinforces that the genetic code is both degenerate and patterned and sets you up for a later, more advanced look at how codon usage patterns affect expression and behavior.
Bring it into 3D: checking your predictions
If you have time or device access, you can invite students to check their hydrophobic vs charged predictions in a 3D model using the codon‑chart extension in the Digital Modeling Hub. This is an optional way to close the loop on the introductory pause point.
Ask them to visualize the protein sequence they decoded, identify where yellow hydrophobic residues cluster, and see how red and blue charged residues orient toward the solvent. Then have them compare that view with their earlier predictions from the codon chart pause point, reinforcing that they were reading real structural information from the sequence.
You can offer this as a challenge for early finishers or a short planned follow-up in another class session, depending on your time and device access.
Your next “stop, decode, discuss”
For many courses, this 10‑minute pause point is enough for students to see translation as a series of codon‑by‑codon decisions with chemical consequences. If your students are ready for the next step, you can later use the same Genetic Codon Chart to go beyond single mRNA snippets and ask richer questions about protein behavior. In a follow‑up post, we’ll share a deeper‑dive codon chart practice for advanced high school and introductory college courses that uses real protein sequence and codon preference values as the next rung on this ladder.
When you combine the Flow of Genetic Information Kit© with the Genetic Codon Chart and a brief 3D visualization, you turn a familiar central dogma lab into a richer structure-function experience. The kit grounds DNA, RNA, and proteins in physical models, and the codon chart slows translation enough for students to see codon‑level decisions and notice how different side‑chain properties show up as colors.
The next time your students reach translation, try building in a 10‑minute “Stop, Decode, Discuss” moment. Even that brief pause can change how students see the central dogma: not as a memorized pathway, but as a decoding process with clear rules and visible consequences. From there, you can decide whether—and when—to extend into mutation classification, codon preference, or 3D modeling in later lessons.
.jpg?height=200&name=0D6A9441%20(1).jpg)